

Weekly Market Weather, Apr 7, 2024
A big crack in short-term breadth. ETF watchlist for next week.

“One of the funny things about the stock market is that every time one person buys, another sells, and both think they are astute.”
— William Feather
Global markets (ETFs representing major benchmarks)
Gold and commodities lead, bonds continue to lag.
[On a geek’s note, I use both percentage change and percentage closing range (between the high and the low) for each period to get relative strength rankings. I also smooth these out across two periods (e.g. current/last week and the previous, current quarter and the previous etc.).]
US market (ETFs representing the major indices and sectors)
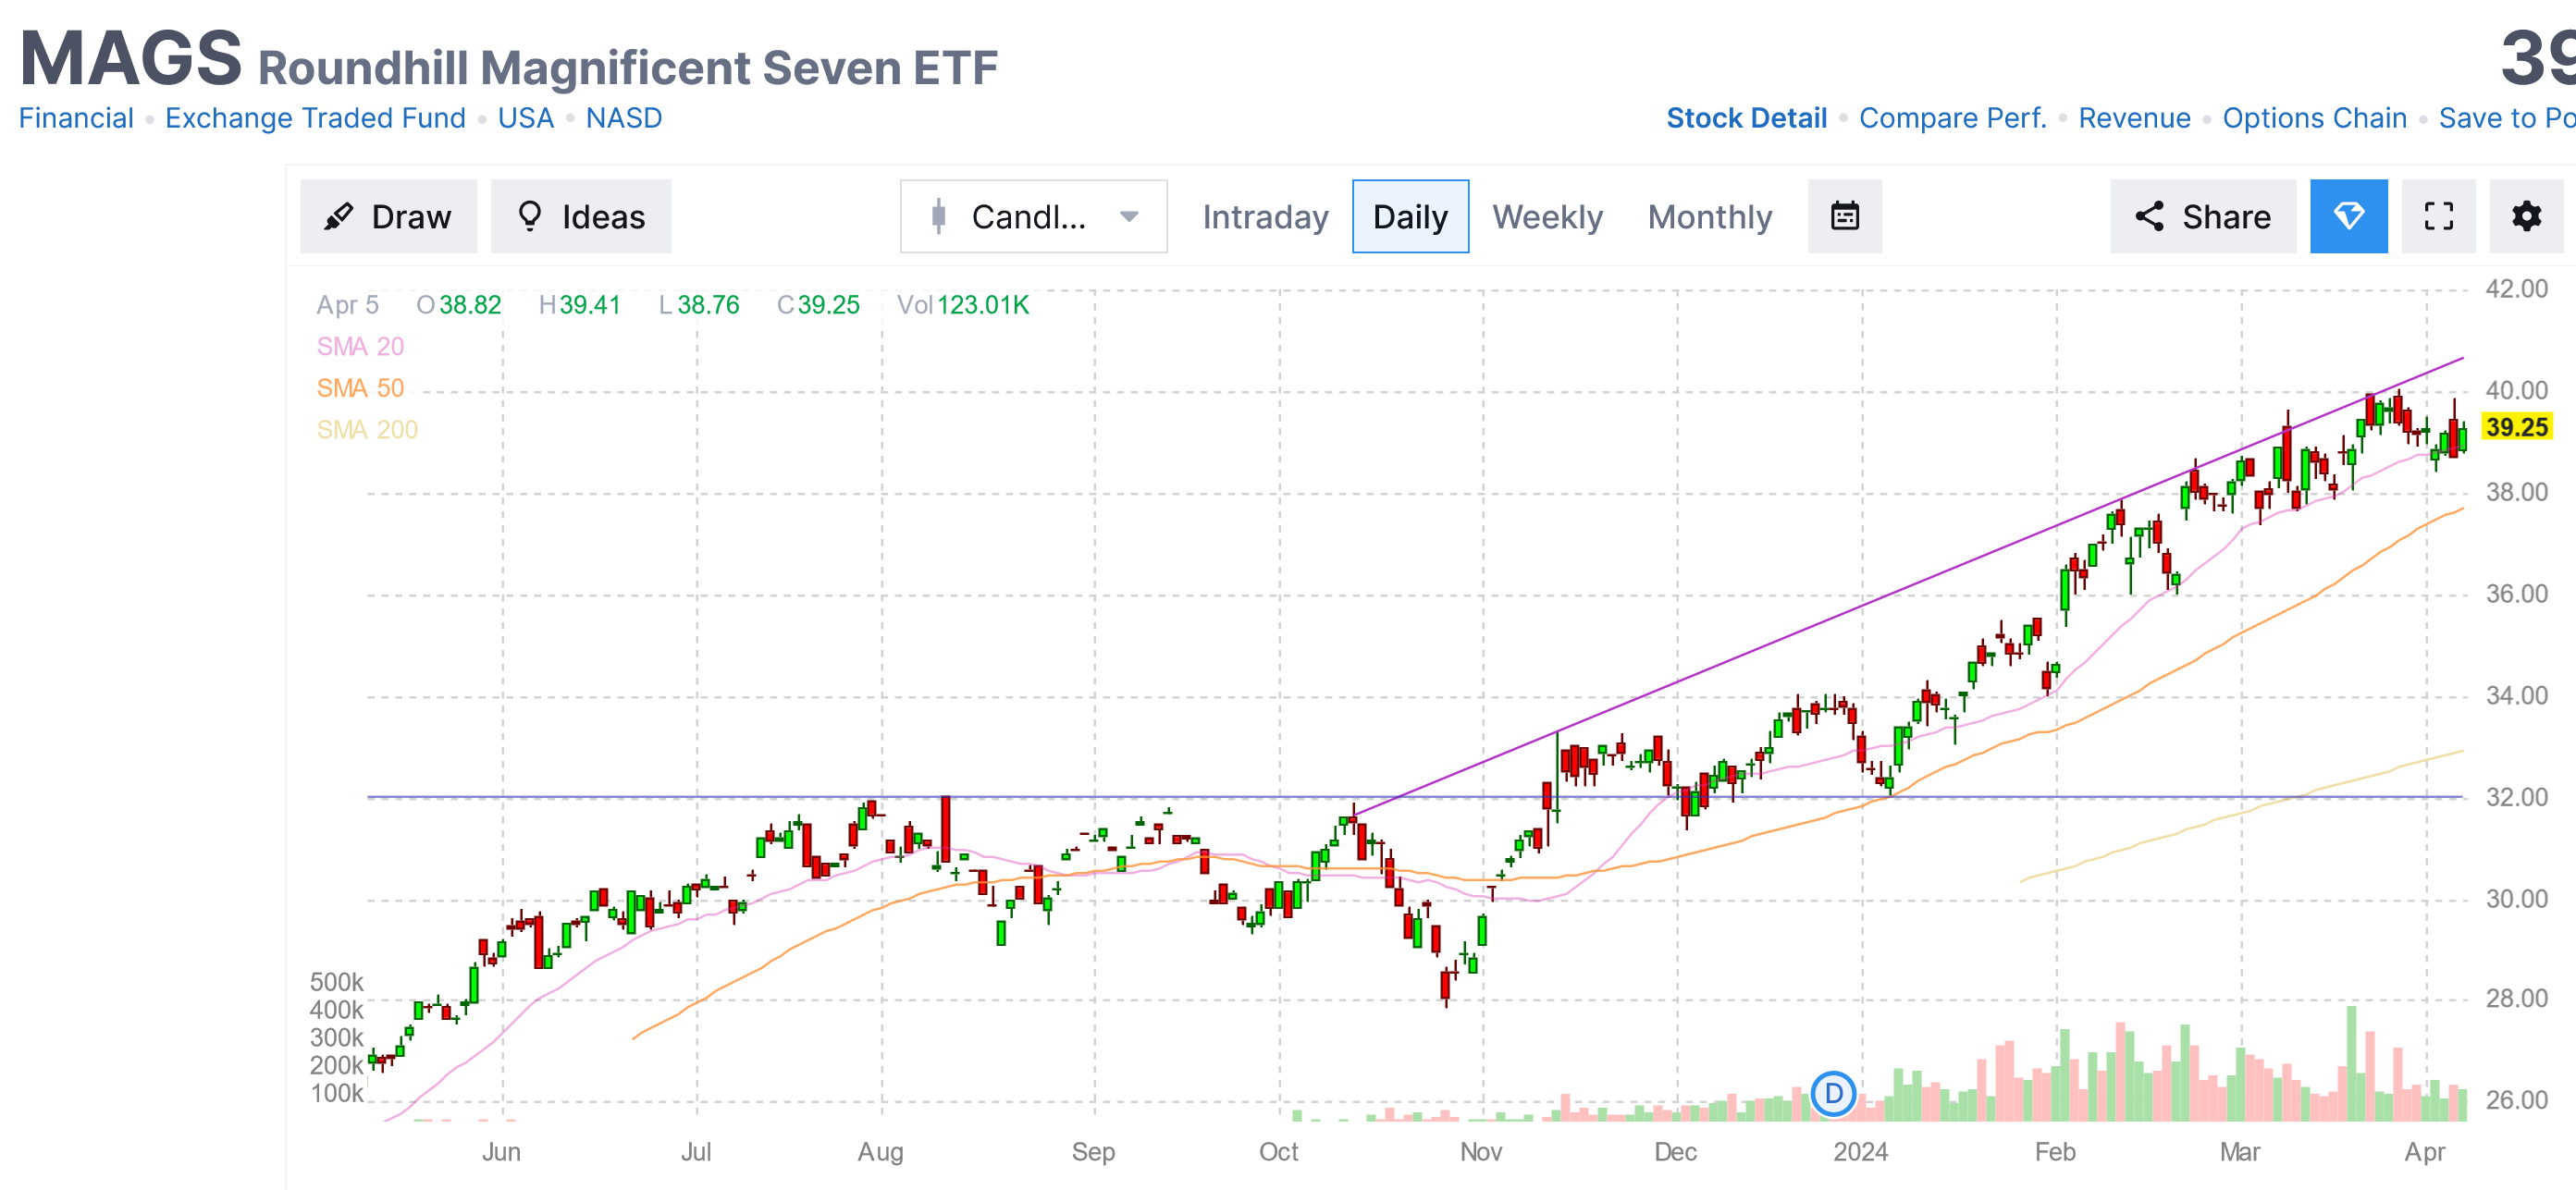
All 4 major indexes are facing pressure in Q2, but all positive YTD. Cyclical sectors still lead, but utilities are rising up the ranks, while Consumer Discretionary is at the bottom. The large-cap darlings are barely holding the 20-d MA. Last chance for a bounce?
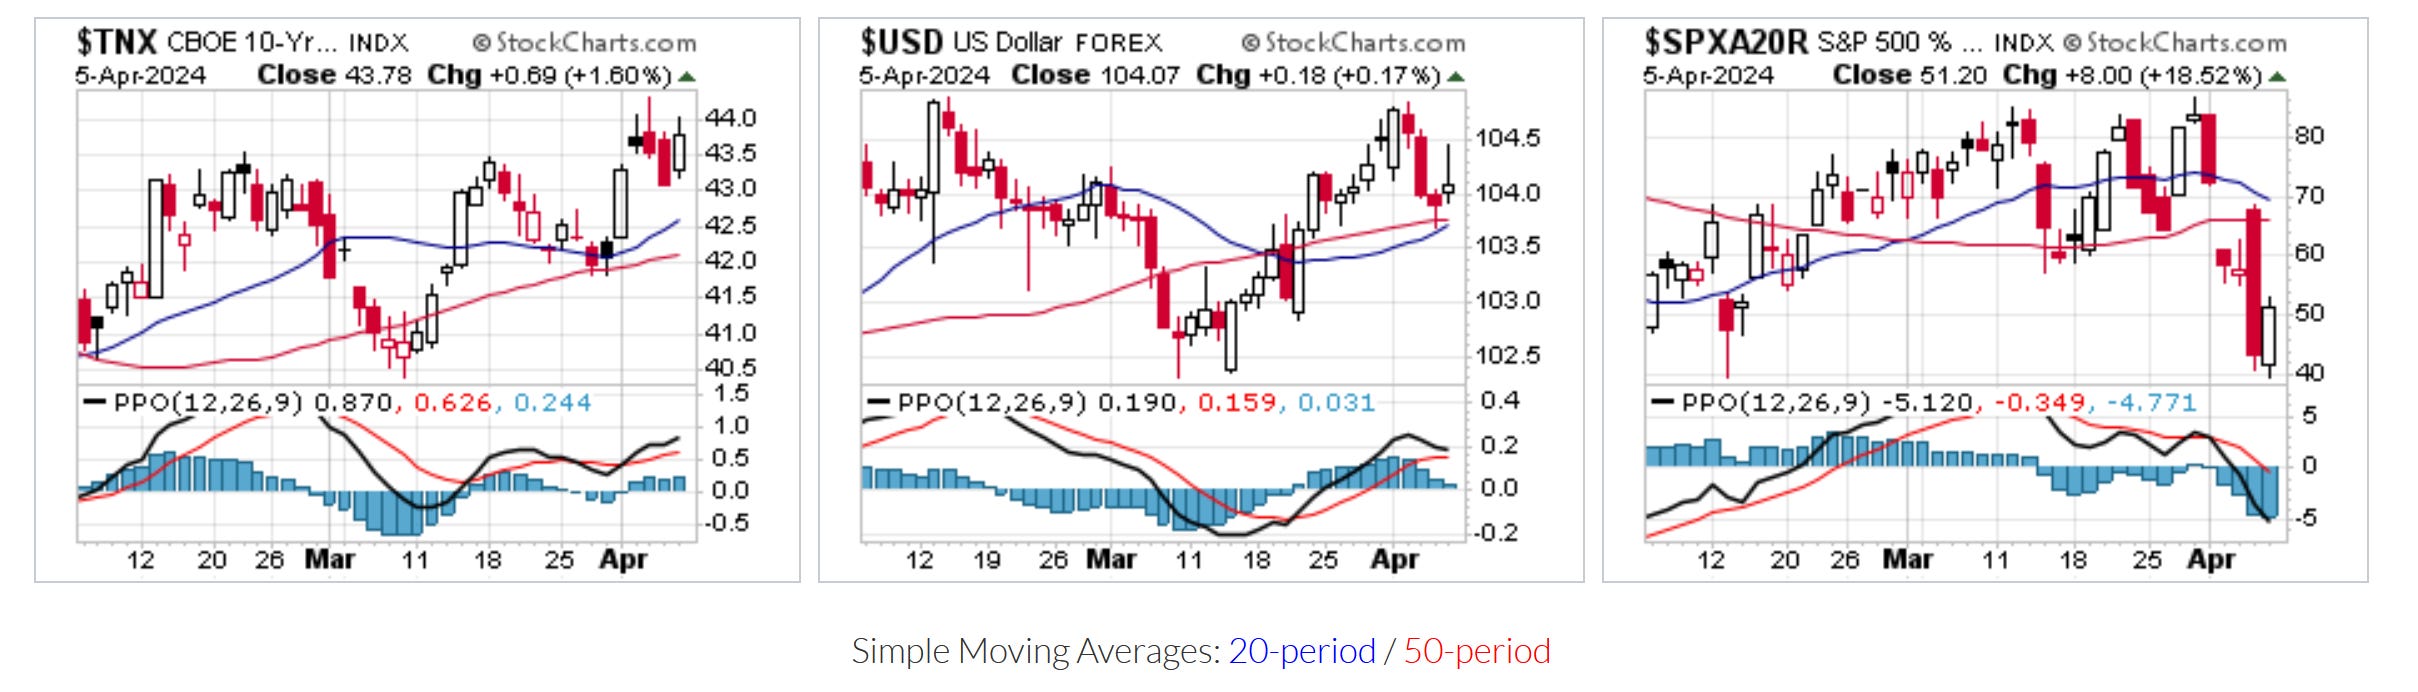
Interest rates, the US Dollar remain bullish, and the short-term breadth (percent of S&P500 stocks above their 20-day moving averages) is correcting. The huge red Thursday candle below the moving averages tells me to be cautious. Stocks have now acknowledged the headwinds from the Dollar and the rates?
Beyond price and trend:
Stock valuations remain remarkably high, especially in the US. I do not use valuation for timing my entries/exits, but as a value-conscious trend-follower, I certainly don’t fight trends. Unless the trend is down, I am happy to play “musical chairs”. 🙂
Market breadth is the health of the overall market, measuring the number of stocks participating in uptrends. We want to see advancing stocks outnumber the declining ones, and the dollar traded volume of the former exceed the volume of the latter. Also, stocks making new yearly highs must outnumber the stocks making new lows — positive for NYSE and less so for NASDAQ. % of SP500 stocks above the 200-day moving average is greater than 70, which makes this rally sustainable. The 20/50-day breadth is coming off the overbought level.👀
US Sentiment. To use sentiment as a contrarian signal, I want to see extreme fear or greed. No the case yet. Longer-term, the ‘Magnificent Seven’ (GOOG 0.00%↑, AAPL 0.00%↑, MSFT 0.00%↑, META 0.00%↑, NVDA 0.00%↑, TSLA 0.00%↑) have been running the party for more than a decade. History shows, leadership for the new bull run must change. Additionally, even at the S&P 500 low in October 2022, US household equity exposure didn’t dip below its long term average, per Hi Mount Research.
Seasonality. Q1 tends to be weak in US elections years (h/t David Keller’s Market Misbehavior), but it hasn’t turned out that way. The “January barometer” is supportive for bulls in the calendar year’s span. April is generally favourable.
Summary and portfolio positioning. My paper-trading portfolio is down 0.35% since Aug ‘23. Last week. Took a hit last week with some untimely shorts. Currently 78% in cash, the rest is allocated as follows:

Going into the next week(s), the mid-/long-term trend is intact, watching the short-term crack in breadth ($SPXA20R). I want a quick recovery above 60% and a higher low. Some ETFs that I’m watching: CPER 0.00%↑ INFL 0.00%↑ PIE 0.00%↑ (thinly traded) RLY 0.00%↑ XME 0.00%↑ EWN 0.00%↑ CGXU 0.00%↑ VSS 0.00%↑ EWU 0.00%↑ EWC 0.00%↑ EPOL 0.00%↑ FRDM 0.00%↑ ICOW 0.00%↑ — not an exhaustive list, watch my real time paper trading here. I am looking for low risk entries and posting scenarios and watchlists in the notes and on X/Twitter during the week. Stay tuned! 👀
None of this is investment advice. My activities are for personal journaling, educational and entertainment purposes only. Learn more about my approach from the pinned post and do your own research!